Call center metrics and advanced statistics to track your performance
Call center metrics deliver essential information on your teams’ activity and performance in clear, easy-to-use tables for your call center reporting. Leverage call center statistics to improve customer satisfaction and your bottom line.
Monitor every last detail of your activity
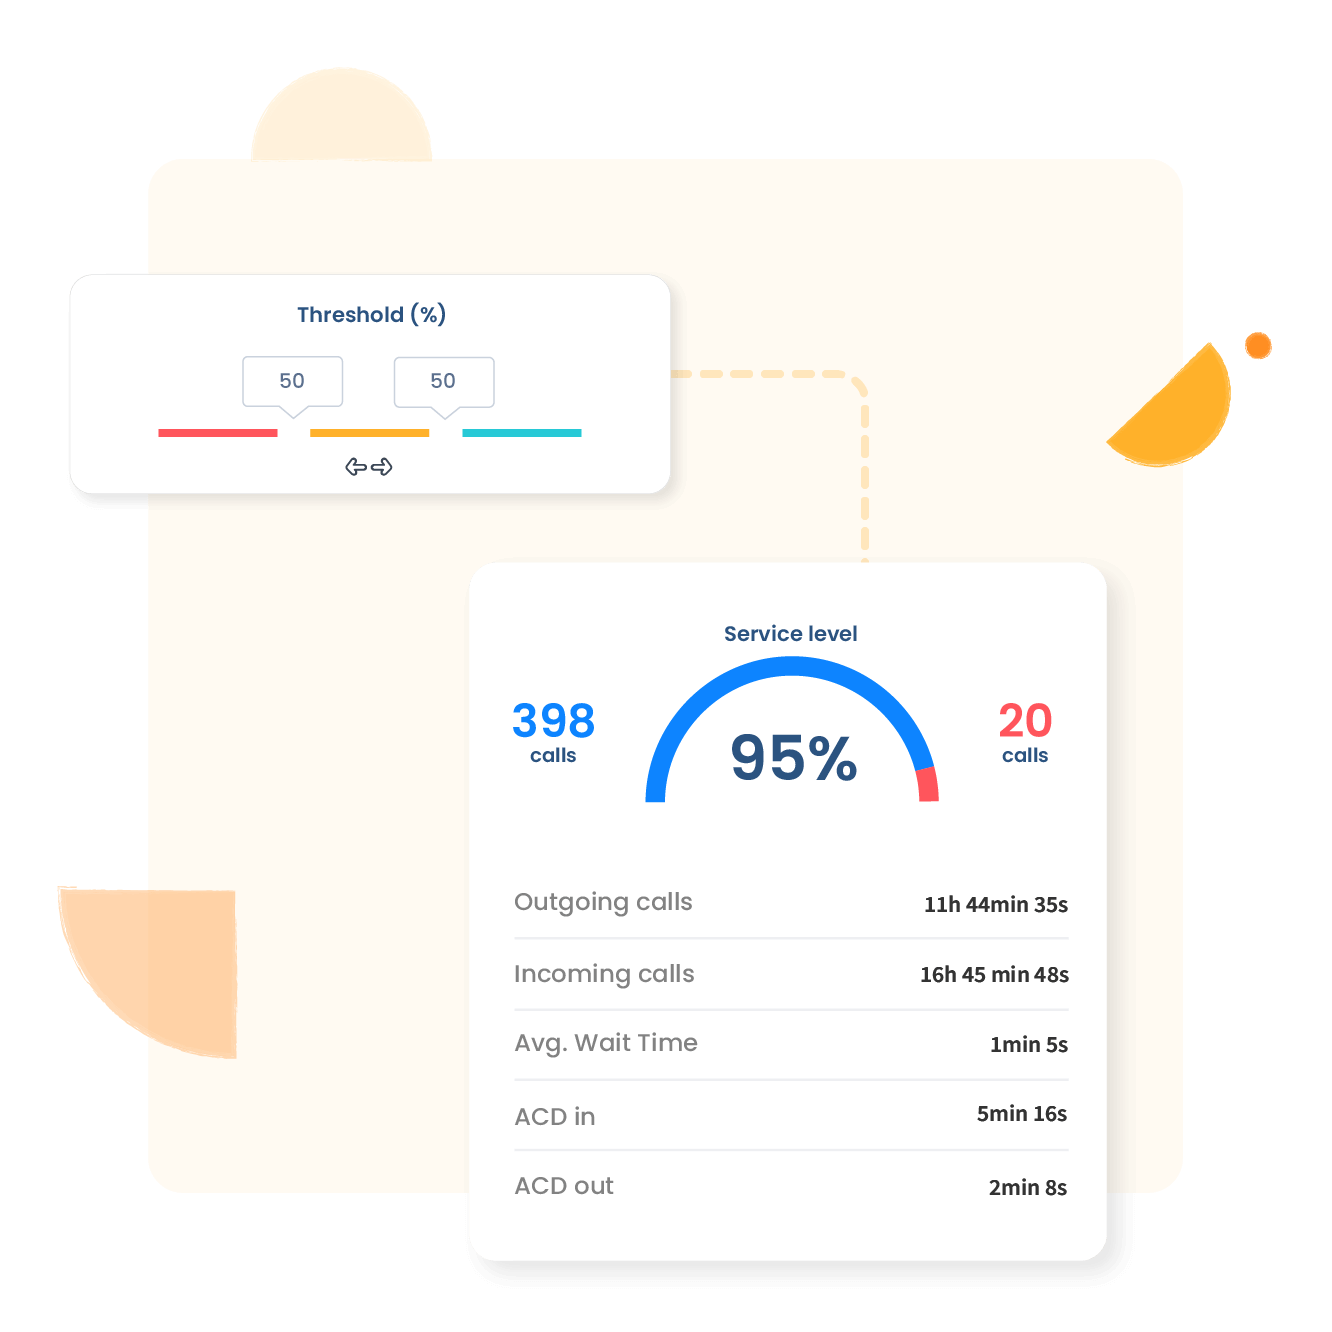
Manage your telephone activity in detail
Wait time, average call length, pick-up rate, service quality level, missed calls processing, etc.
This access to relevant indicators enables you to assess your team’s performance efficiently. You’ll easily exclude calls that aren’t useful or that interfere with the analysis (internal calls, calls outside of business hours, etc.).
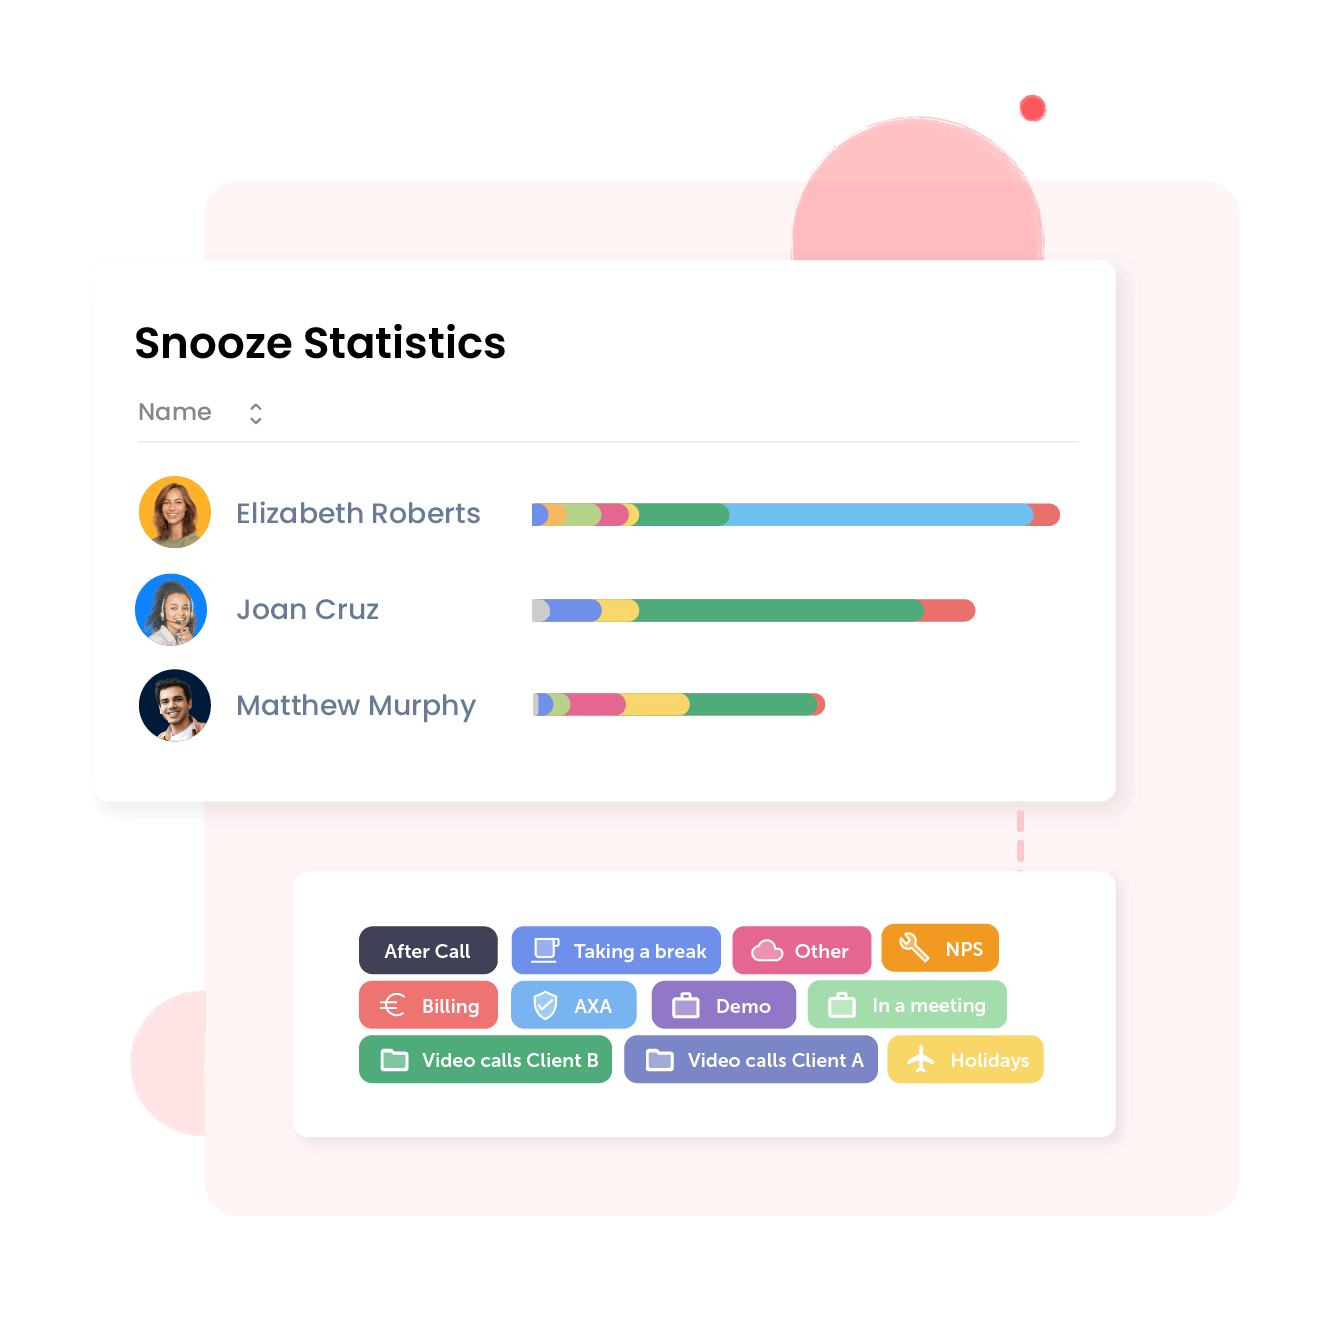
You can also monitor time spent on other tasks
Clearly identify what your employees are doing when they’re not on calls through real-time insights into agent unavailability and the reasons as to why they’re not available.
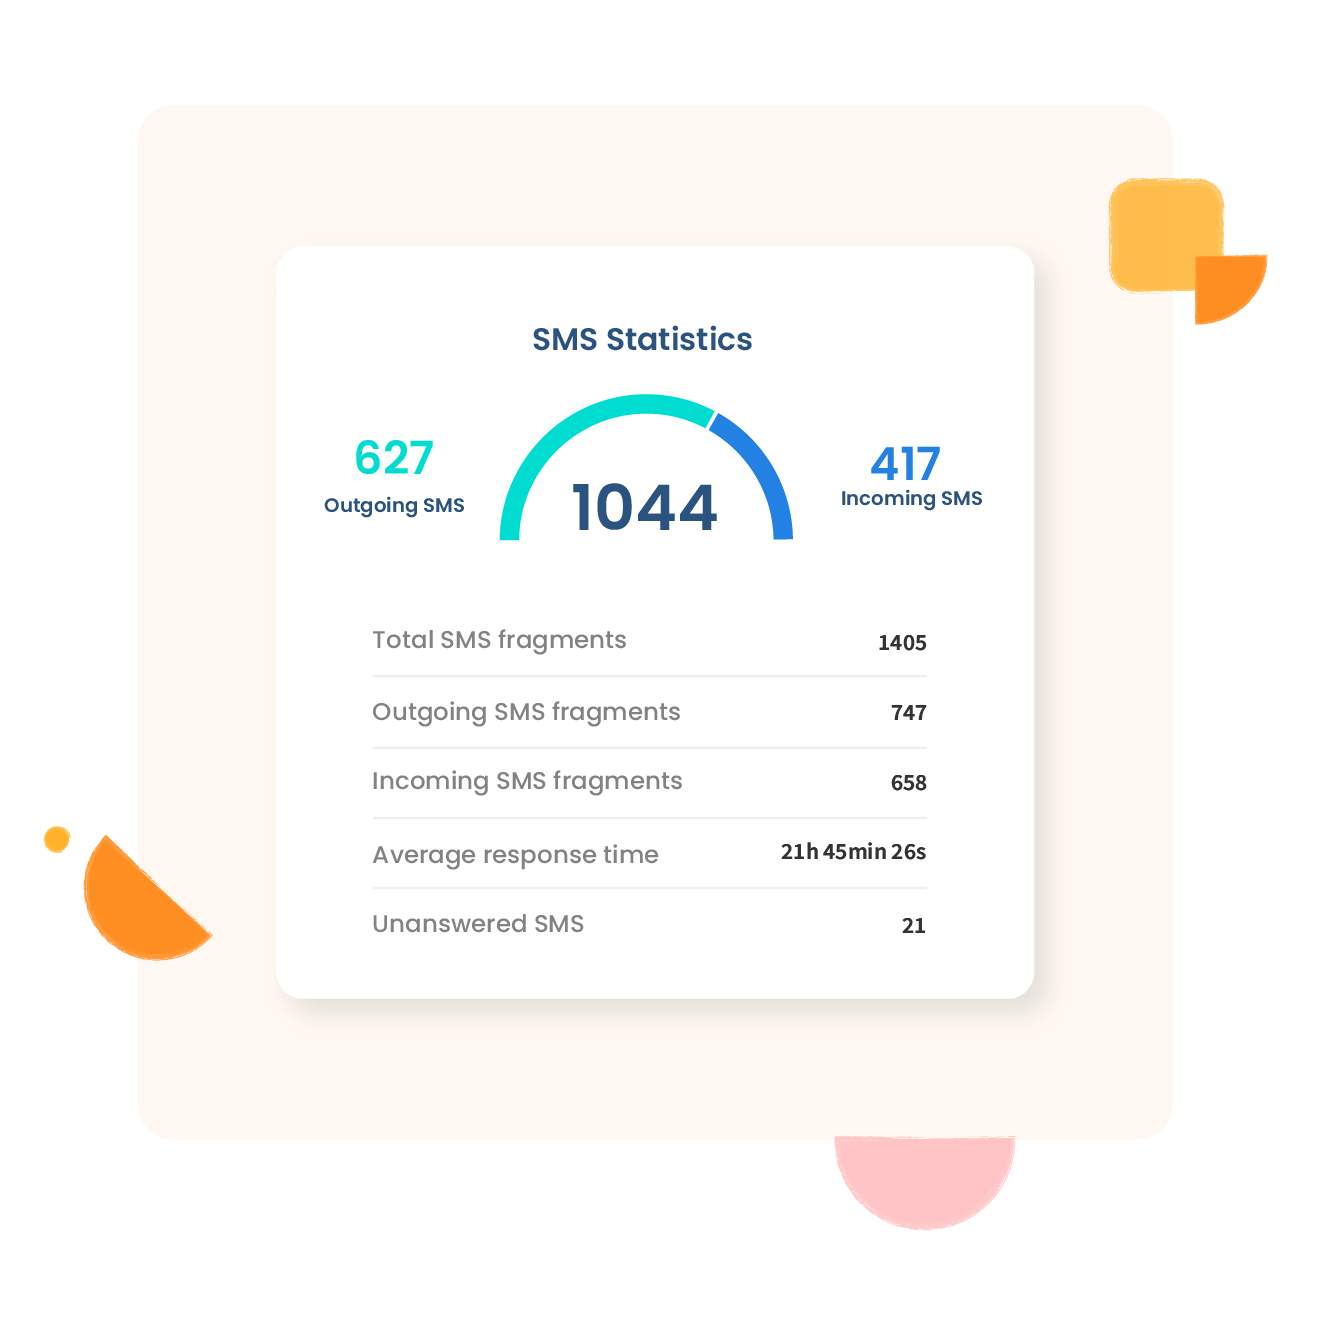
View the essential information on your SMS
Access relevant data on all your SMS messages, including total volume sent, average response time, number of unread SMS messages, etc.


Take control over your teams’ performances
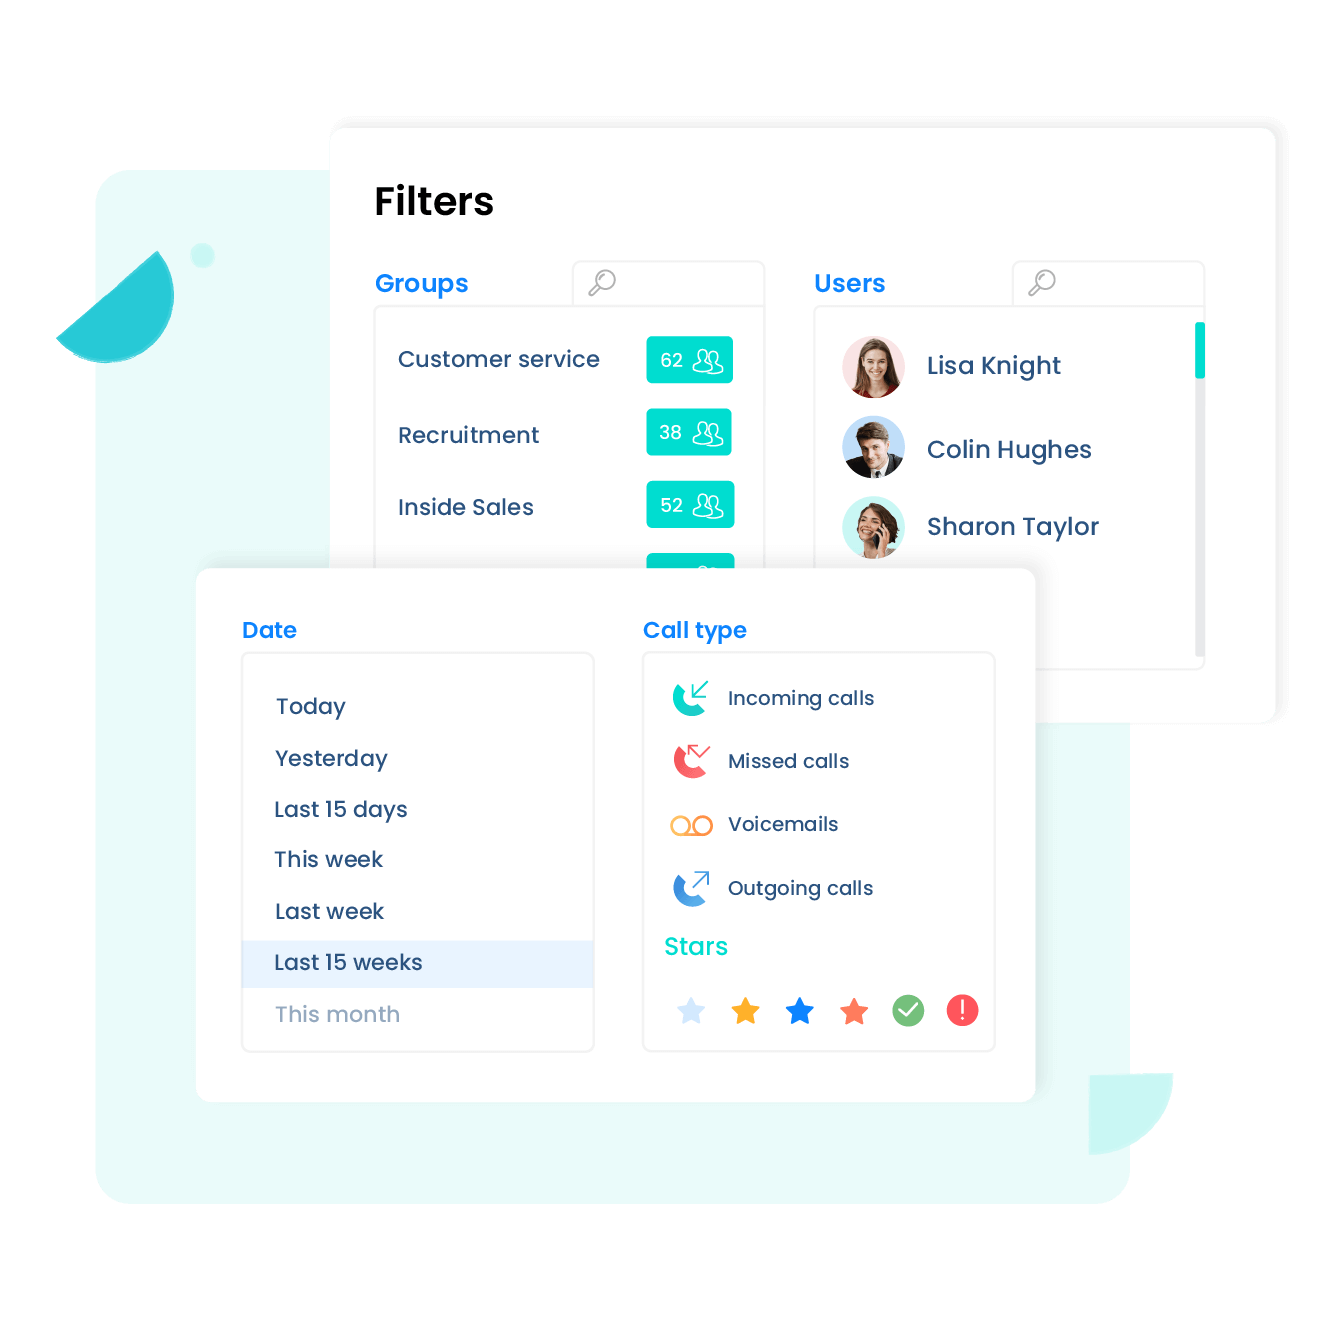
Analyze precisely your activity through filters
Filter your statistics based on call type, by user, by group, or even by number.
Easily monitor the essential KPIs of your salespeople or analyze the performance of your customer support (how long your callers spend in the queue, how many calls take too long to be answered, and more).
Anticipate resource requirements in the blink of an eye
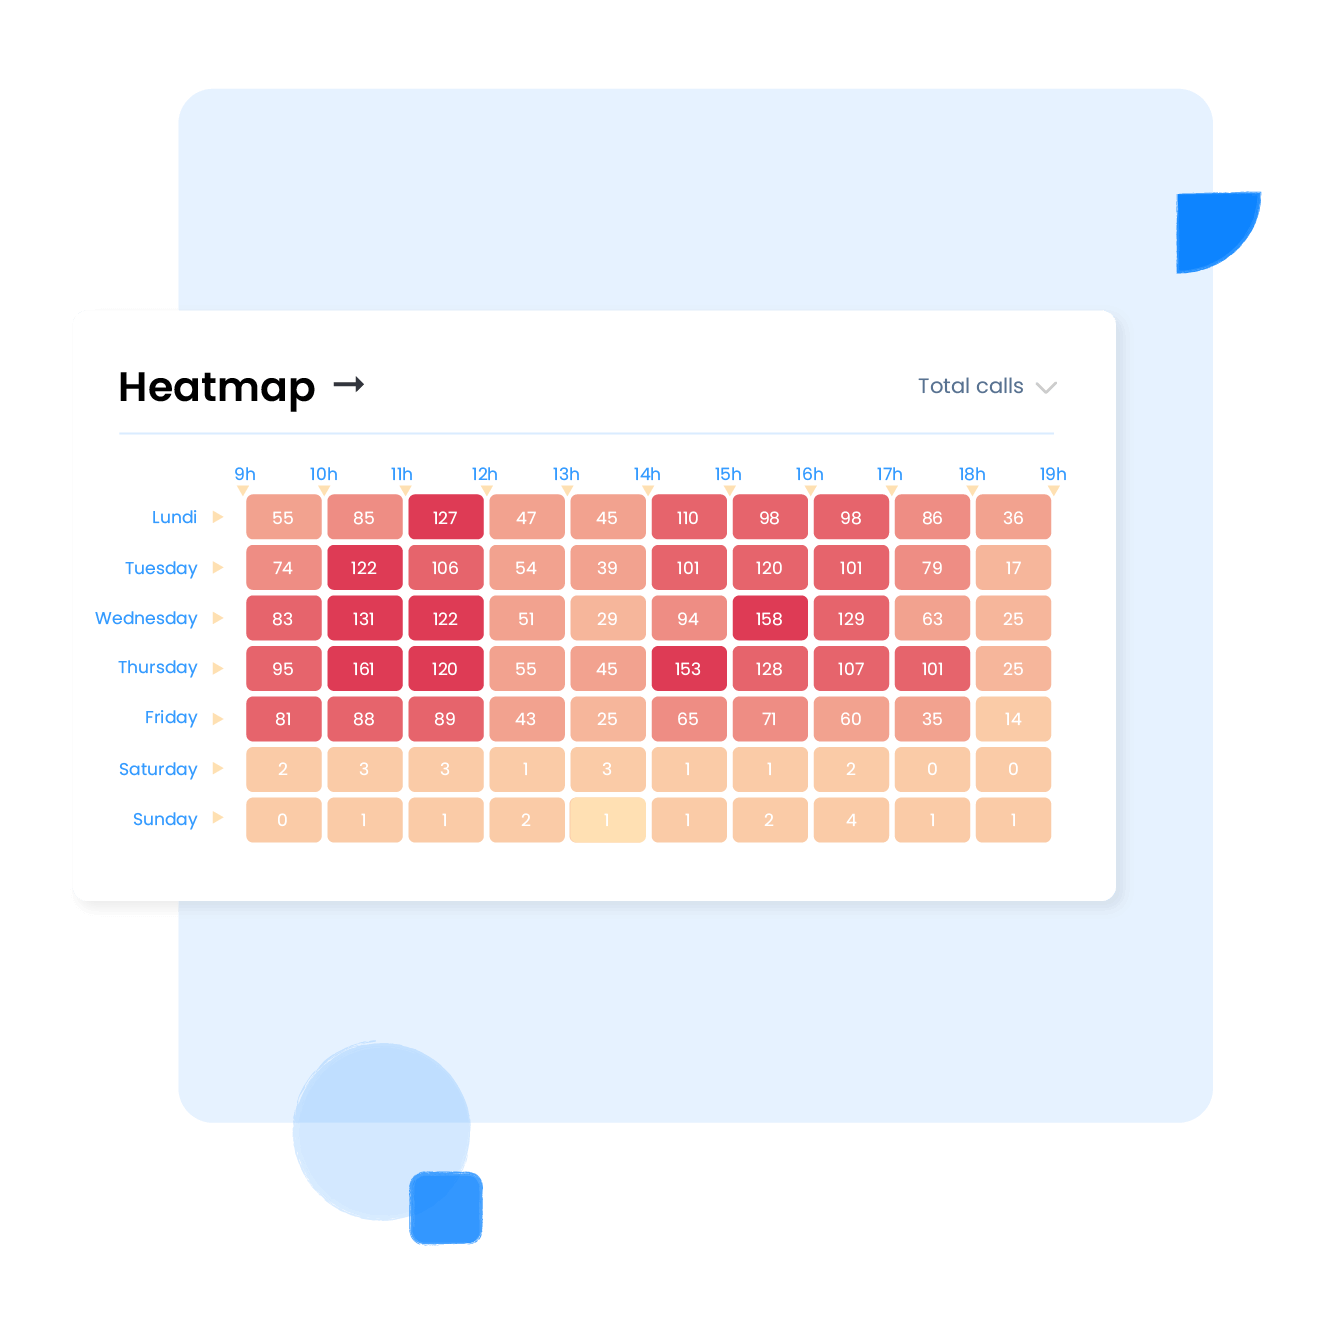
View your hourly activity and service level over the week, presented in a clear, easy-to-interpret heat map. Easily identify any spikes in activity by displaying data in the form of bar charts and curve graphs. Analyse and anticipate your resource requirements to make sure you maintain your service quality.
Create your own reports
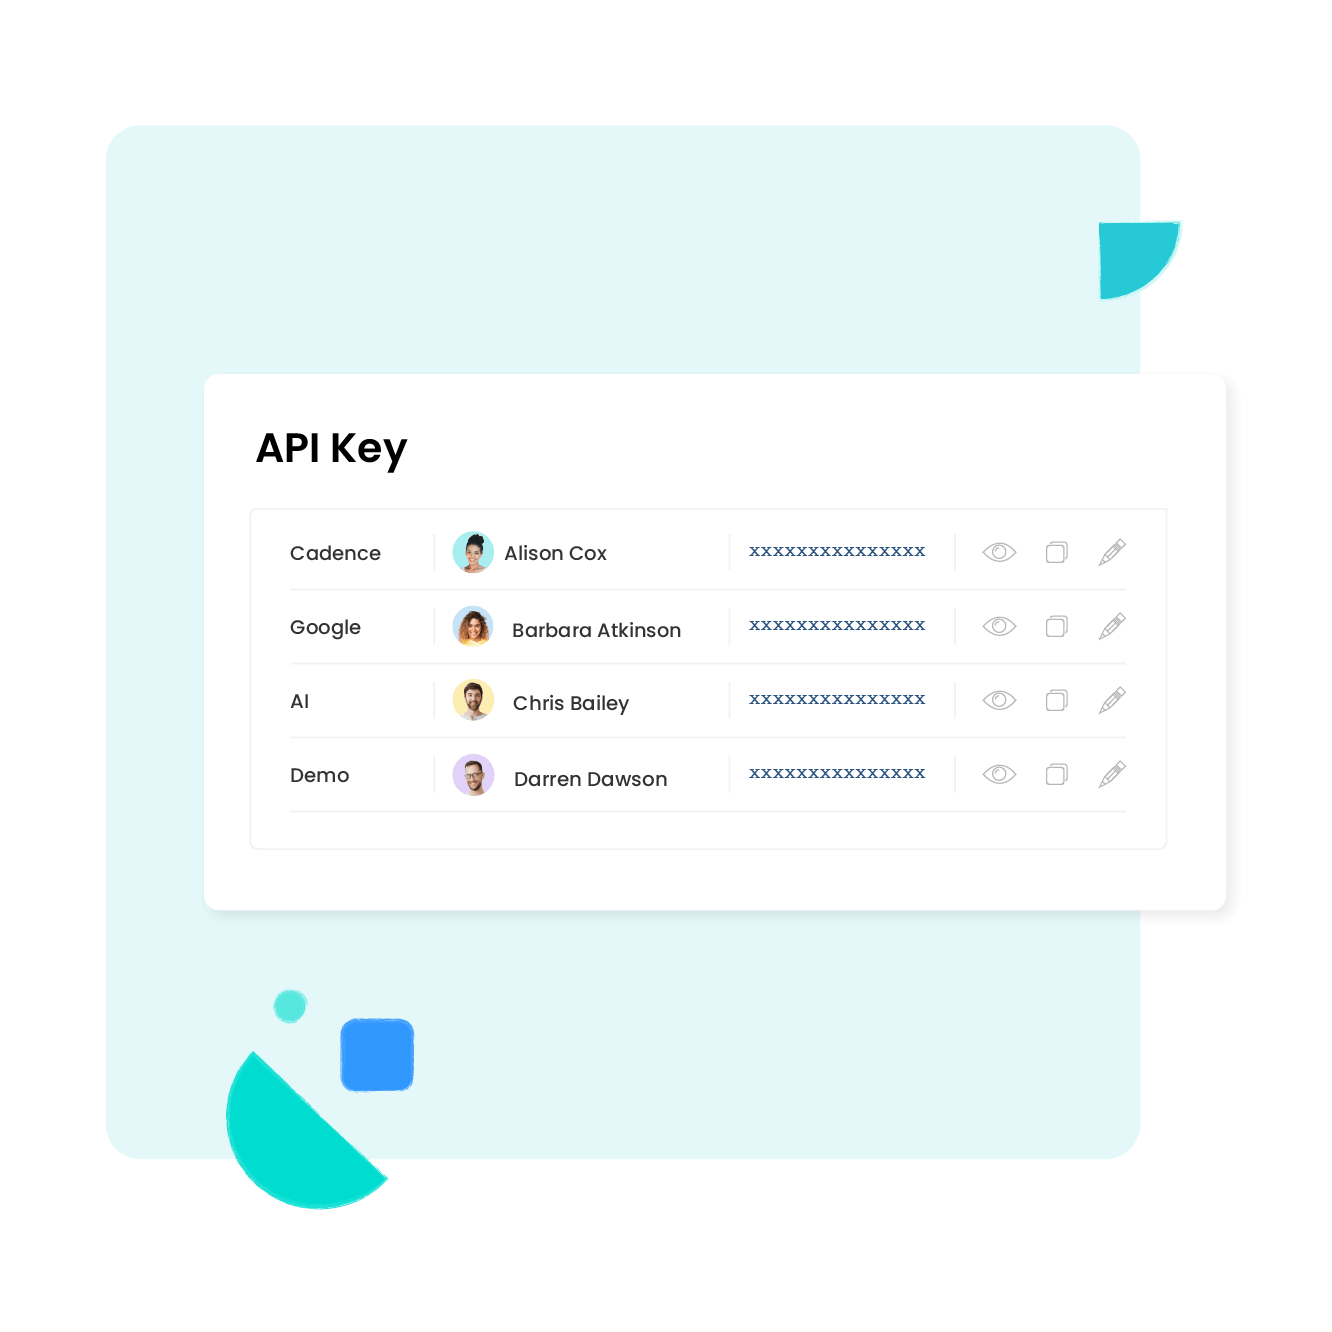
Export or use the API to gather your data and process it in your internal tools.
FAQs
- Do all users have access to statistics?
- Are all calls taken into account in the statistical calculations?
- Which indicators are directly accessible from the dashboard?
- Is it possible to personalize my statistics?
- What are metrics in a call center?
- How do you evaluate a call center?
- How do you calculate call center AHT?
- How do you calculate call center occupancy rates?
Do all users have access to statistics?
No, only Administrators and Supervisors have access to statistical data.
Are all calls taken into account in the statistical calculations?
All of the team’s incoming and outgoing calls are taken into account for establishing statistical data. You may nonetheless put personalized filters in place to exclude certain types of calls.
Which indicators are directly accessible from the dashboard?
Ringover directly provides dozens of key indicators for analysing your team’s calls, such as:
- Total number of calls.
- which includes the number of incoming and outgoing calls.
- Number of answered and missed incoming calls.
- Total call duration.
- which includes total duration of incoming and outgoing calls.
- Service level (percentage of answered calls vs. incoming calls).
- Average wait time for incoming calls.
- Average wait time for outgoing calls.
- Queue time.
Is it possible to personalize my statistics?
Yes, you can activate various filters for your data in order to obtain more precise results. By using Ringover’s REST API, it’s also possible for you to retrieve all of your call data for making your own calculations.
What are metrics in a call center?
Call center metrics measure the effectiveness of customer service teams. More specifically, call centric statistics will measure call center performance, agent productivity, and other call center activities that contribute to a great customer experience.
Here are the 10 main call center metrics:
- Service level.
- FCR (First call resolution rate).
- Average handle time.
- Percentage of calls blocked.
- Average call abandonment rate.
- Net promoter score (NPS).
- Average speed of answer.
- Customer effort score (CES).
- Customer satisfaction (CSAT).
- First response time (FRT).
How do you evaluate a call center?
There are a number of call center metrics and tools available for evaluating the performance of a call center, whether in-house or outsourced. Here are some tips to help you:
- First, define your evaluation criteria. Are they call quality, customer satisfaction, response time, number of calls answered or problem resolution?
- Measure agent performance using call center statistics such as FCR (First Contact Resolution Rate), abandonment rate,or average call handling rate.
- Double-listen using call monitoring and the call recording functionality of your call center solution. In fact, the best call center software allows you to use live listening to observe interactions between customers and agents.
- Set up satisfaction surveys to obtain feedback from your customers.
- Collect and analyze data, adjust objectives and track performance. To do this, use the call center reporting features available in your software.
How do you calculate call center AHT?
To obtain the AHT(Average Handling Time), here’s the formula to use:
Call duration + time spent processing the post-call request
How do you calculate call center occupancy rates?
The occupancy rate formula is as follows:
Sum of all agents’ available hours / Agent working time x 100